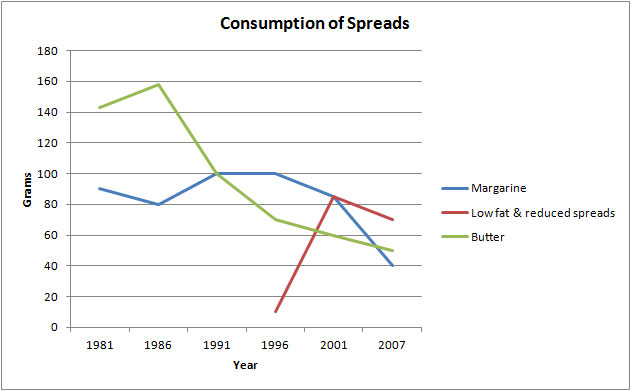
The line graph below shows the consumption of three types of spreads (margarine, low fat spreads and butter) from 1981 to 2007. Summarise the information by selecting and reporting the main features, and make comparisons where relevant. Write at least 150 words.
Your essay
0 / 150 từHỏi Thầy Huy về cách viết bài này